
Sporadic E layers
Sporadic E layers (also abbreviated as Es layers) are thin sheets of enhanced electron concentration in the form of clouds or patches located in the ionospheric E region at heights typically around 90 – 120 km. They have been observed since the beginning of ionospheric observations using the early ionosondes. The Es layers can be seen as thin horizontal lines on the ionograms (Fig. 1). Major constituents are positive long-lived metallic ions (Mg+, Fe+, Na+, Ca+). Although the term “sporadic” might imply rare and/or irregular behavior, our current knowledge tends to understand that the Es layers as rather regular phenomena with strong seasonal and geographic dependence. However, many questions still remain and often the word “mystery” is connected with them (e.g. Haldoupis et al., https://agupubs.onlinelibrary.wiley.com/doi/pdf/10.1029/2007JA012322 ).
The critical frequency foEs (maximum plasma frequency of the layer) often exceeds the critical frequency of the E, or even F layer and thus the Es behavior is important factor for propagation of radio waves. Sporadic E layers are well known among the amateur radio community as they allow transmission of signals on much higher frequencies than would be allowed otherwise. On the other hand, they can strongly degrade the communication and navigation satellite systems.
For the Es studies, we use mainly the ground based DPS-4D (digisonde) instrument located in Průhonice as well as observations from other stations. Recently, we have used synchronized measurements between the digisondes to increase spatial resolution and to specify horizontal range of the Es layers (Fig. 2). Namely, we use all three combinations of paths between Sopron (Hungary), Dourbes (Belgium) and Pruhonice (Czech Republic).
Sporadic E layers in the middle latitudes are explained as a product of wind shears which lead to convergence of metallic ions and thus localized increased of charged particles. The formation of Es is affected by the tidal waves (periods 24, 12, 8, and 4 hours) as well as by the planetary waves as they modulate the tidal waves.
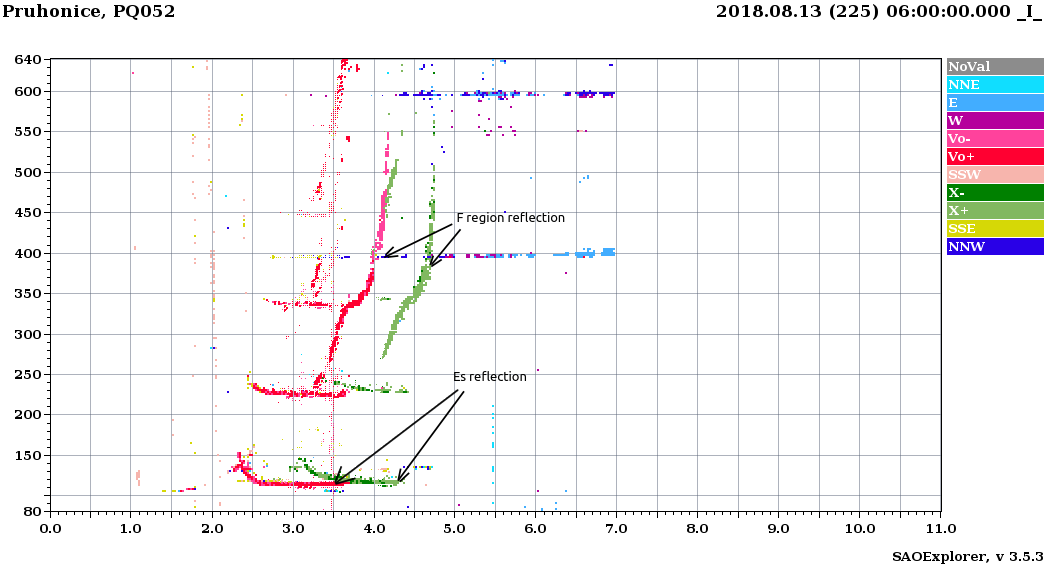
Figure 1: Ionogram from the Průhonice station. Red and green colors denote ordinary and extraordinary reflections, respectively. The Es layer is observed as thin line at height 115 km.
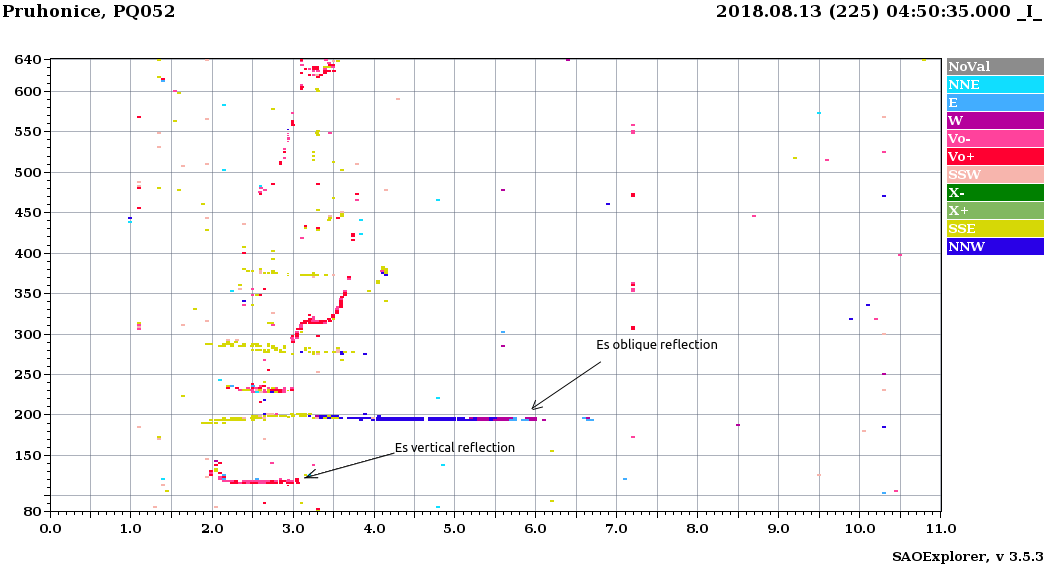
Figure 2: Oblique Es reflection was observed in the middle of the path Sopron, Hungary (transmission of the signal) to Průhonice (receiving station). Vertical reflection (Průhonice to Průhonice transmission) is denoted as well.
Midlatitude Spread F
The term spread F describes a situation when the stratification of the ionosphere is disrupted due to irregularities at various spatial scales. Consequently, multiple reflections from the disturbed ionosphere are detected. Therefore, instead of a clear reflection from the F region (Figure 3) we obtain diffuse trace (Figure 4). In middle latitudes, spread F situation is often connected to a passage of Traveling Ionospheric Disturbances (TIDs) which modify the profile of electron density. The spread F situation is also often observed during increased geomagnetic activity (Mošna et al., 2019) as well as a result of neutral atmosphere forcing. For example, spread F situation was observed due to tropospheric forcing on the ionosphere after passage of cold front above the Czech Republic (Koucká Knížová et al., 2020).
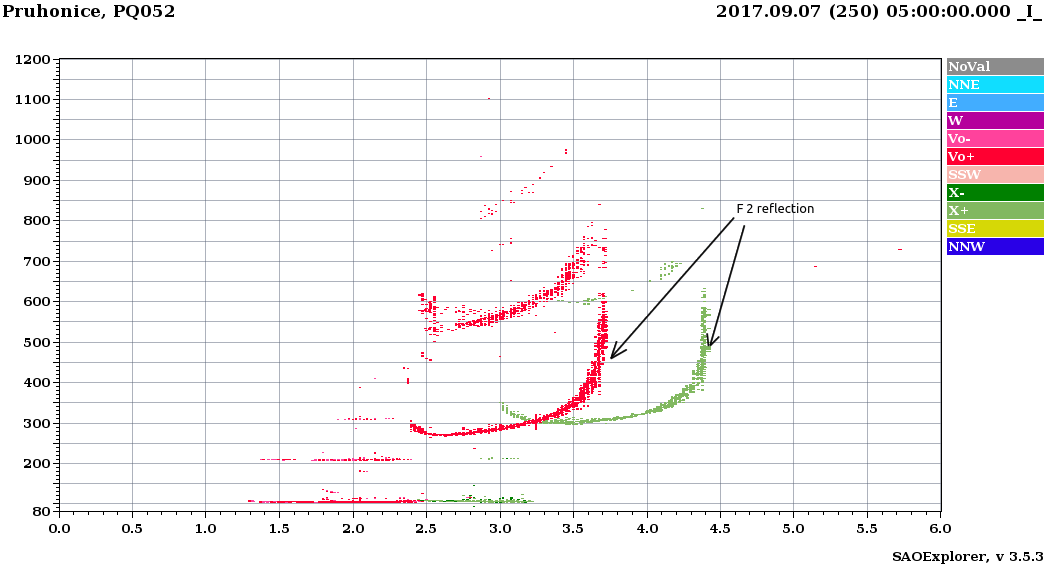
Figure 3: Ionogram from the Průhonice station. Situation with regular (undisturbed) echo from the F2 region. Red and green colors denote ordinary and extraordinary reflections, respectively.
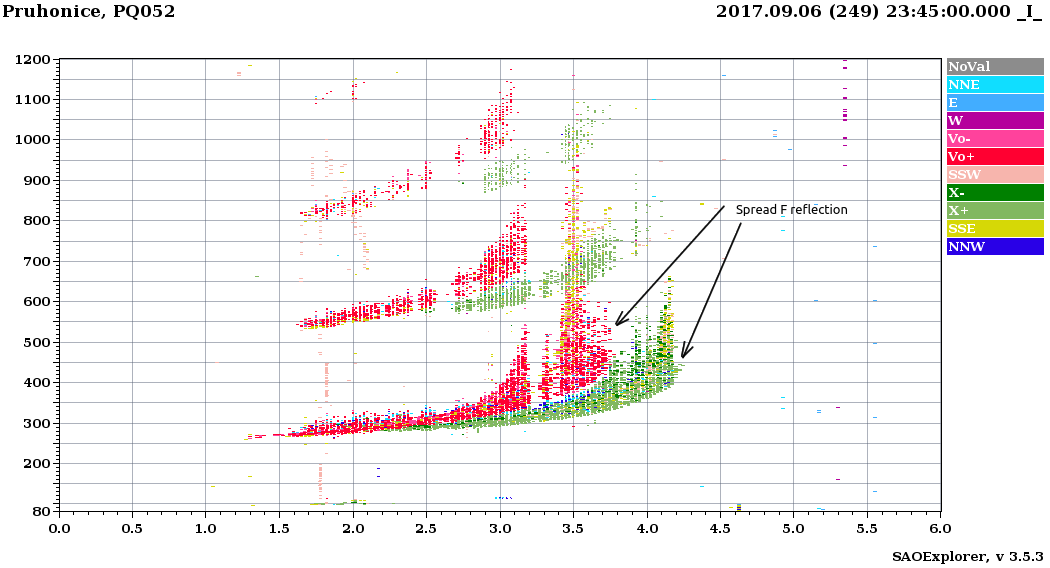
Figure 4: Disturbed ionogram with the spread F situation. The F2 region is influenced by a strong geomagnetic activity leading to diffuse reflection ordinary (red) and extraordinary (green) traces.
Equatorial and low-latitude spread F
Equatorial spread F (ESF) is often associated with plasma bubbles that strongly influence the reliability of satellite navigation systems and radio communications. It is generally accepted that it results from Rayleigh-Taylor instability triggered by the uplift of plasma around the geomagnetic equator owing to the prereversal enhancement of the eastward (zonal) electric field and development of the steep plasma density gradient as the bottomside ionosphere becomes depleted after sunset. Despite the long-year research, the day-to-day variability and the role of various seeding mechanisms such as atmospheric waves that are likely contributing to evolution of the instabilities are not well understood.
Using our multi-point continuous Doppler sounders that we operate with collaboration with our international partners in Taiwan and Northern Argentina, we investigated the drift velocities and longitudinal differences of the ESF. The ESF is observed in Dopppler shift spectrograms as distinct oblique spread structures as shown in the Figure 5.
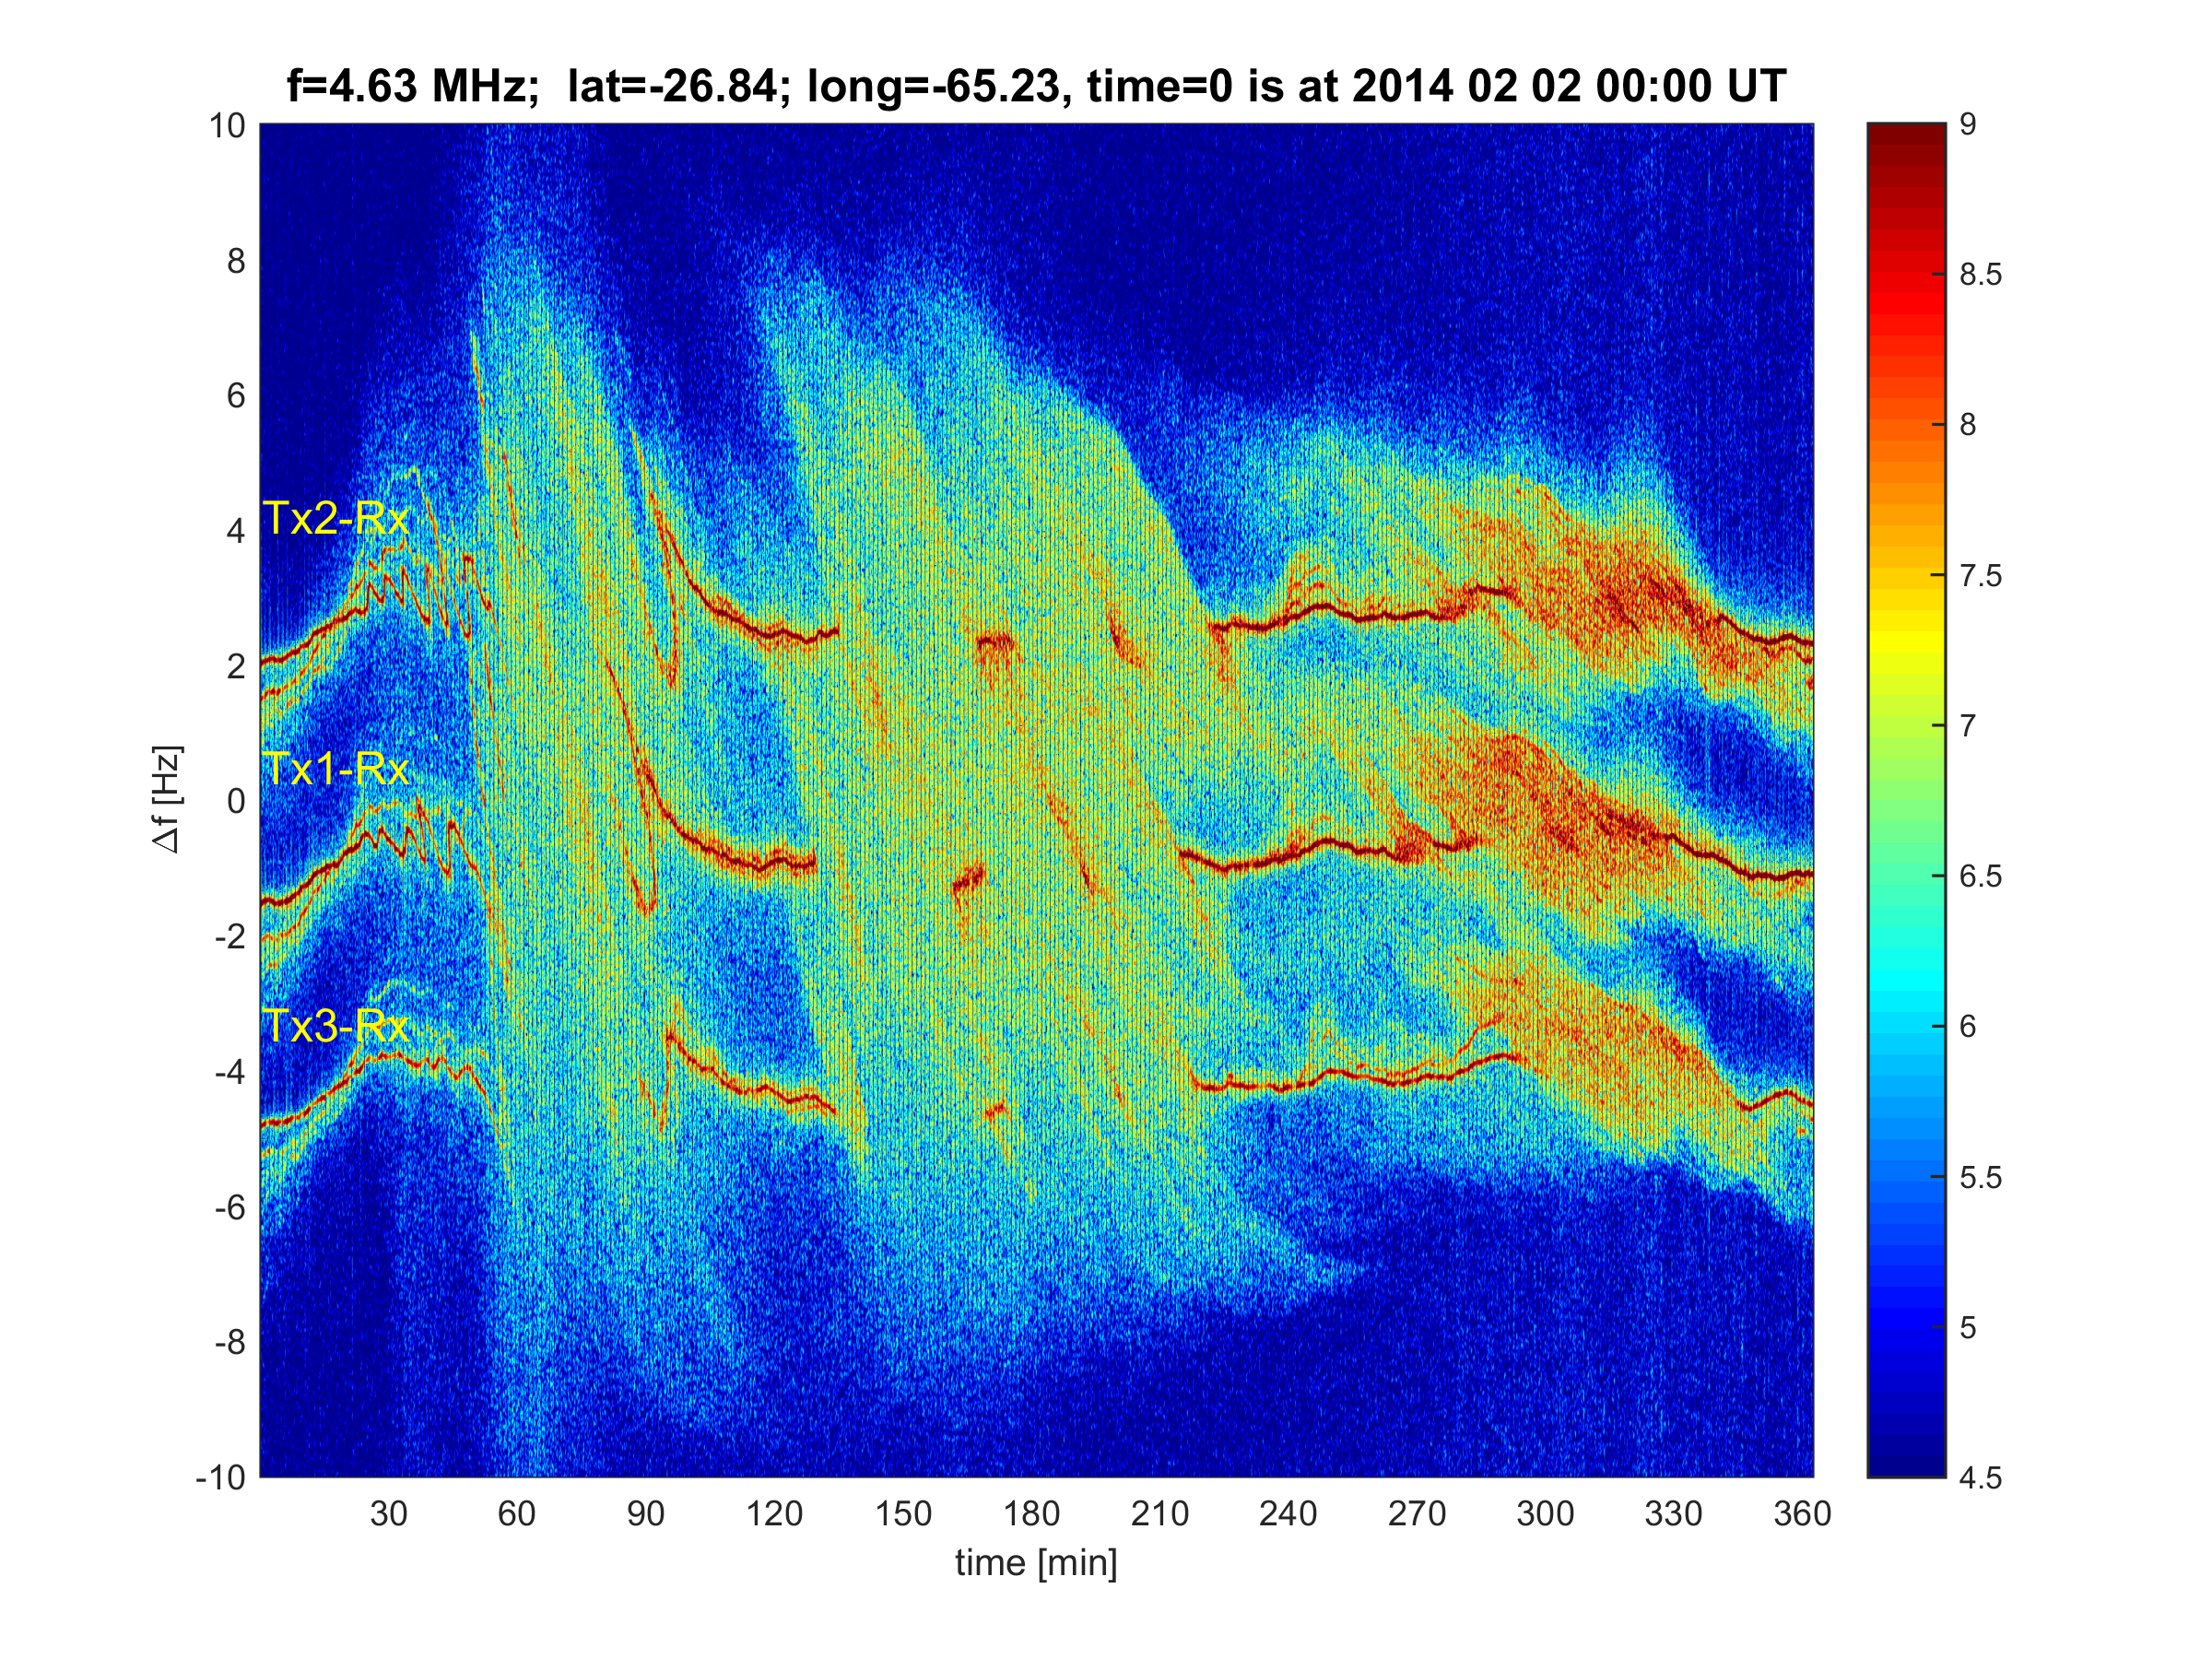
Figure 5: Doppler shift spectrogram computed from the record in Tucuman (Northern Argentina) on 2 February 2014 from 0 to 6 UT.