Rozložení náboje v oblacích

Our research aims at investigating differences in the inner structure of thunderclouds (i.e. clouds producing lightning discharges) and that of clouds which do not produce lightning discharges. For this, we dispose and analyse measurements of a Ka-band cloud profiler (Fig. 1), which was installed at our observatory Milešovka in 2018. Based on the data of the cloud profiler, we developed an algorithm retrieving the vertical air velocity and classifying five to six kinds of hydrometeors (Sokol et al., 2018). In addition to diverse distribution of hydrometeors in thunderclouds and non-thunderclouds, we investigate the relationships between lightning and Linear Depolarization Ratio (LDR) and phase and power spectra of the cloud profiler (Sokol et al., 2020; Sokol and Popová, 2021; Fig. 2, Fig. 3). Our results suggest that the clouds producing lightning discharges typically consist of a mixture of hydrometeors (supercooled liquid water, graupel and ice crystals in particular), which is necessary for cloud electrification. Our results also indicate that lightning discharges usually precede heavy rain by several minutes in the studied area. However, we are planning to refine the results based on larger data set of thunderstorms which we will obtain in future. Further, we plan to involve data from a newly installed X-band weather radar at the Milešovka observatory (Fig. 4) into our analyses since the radar provides us with a detailed spatial information (both horizontal and vertical) on thunderstorms.

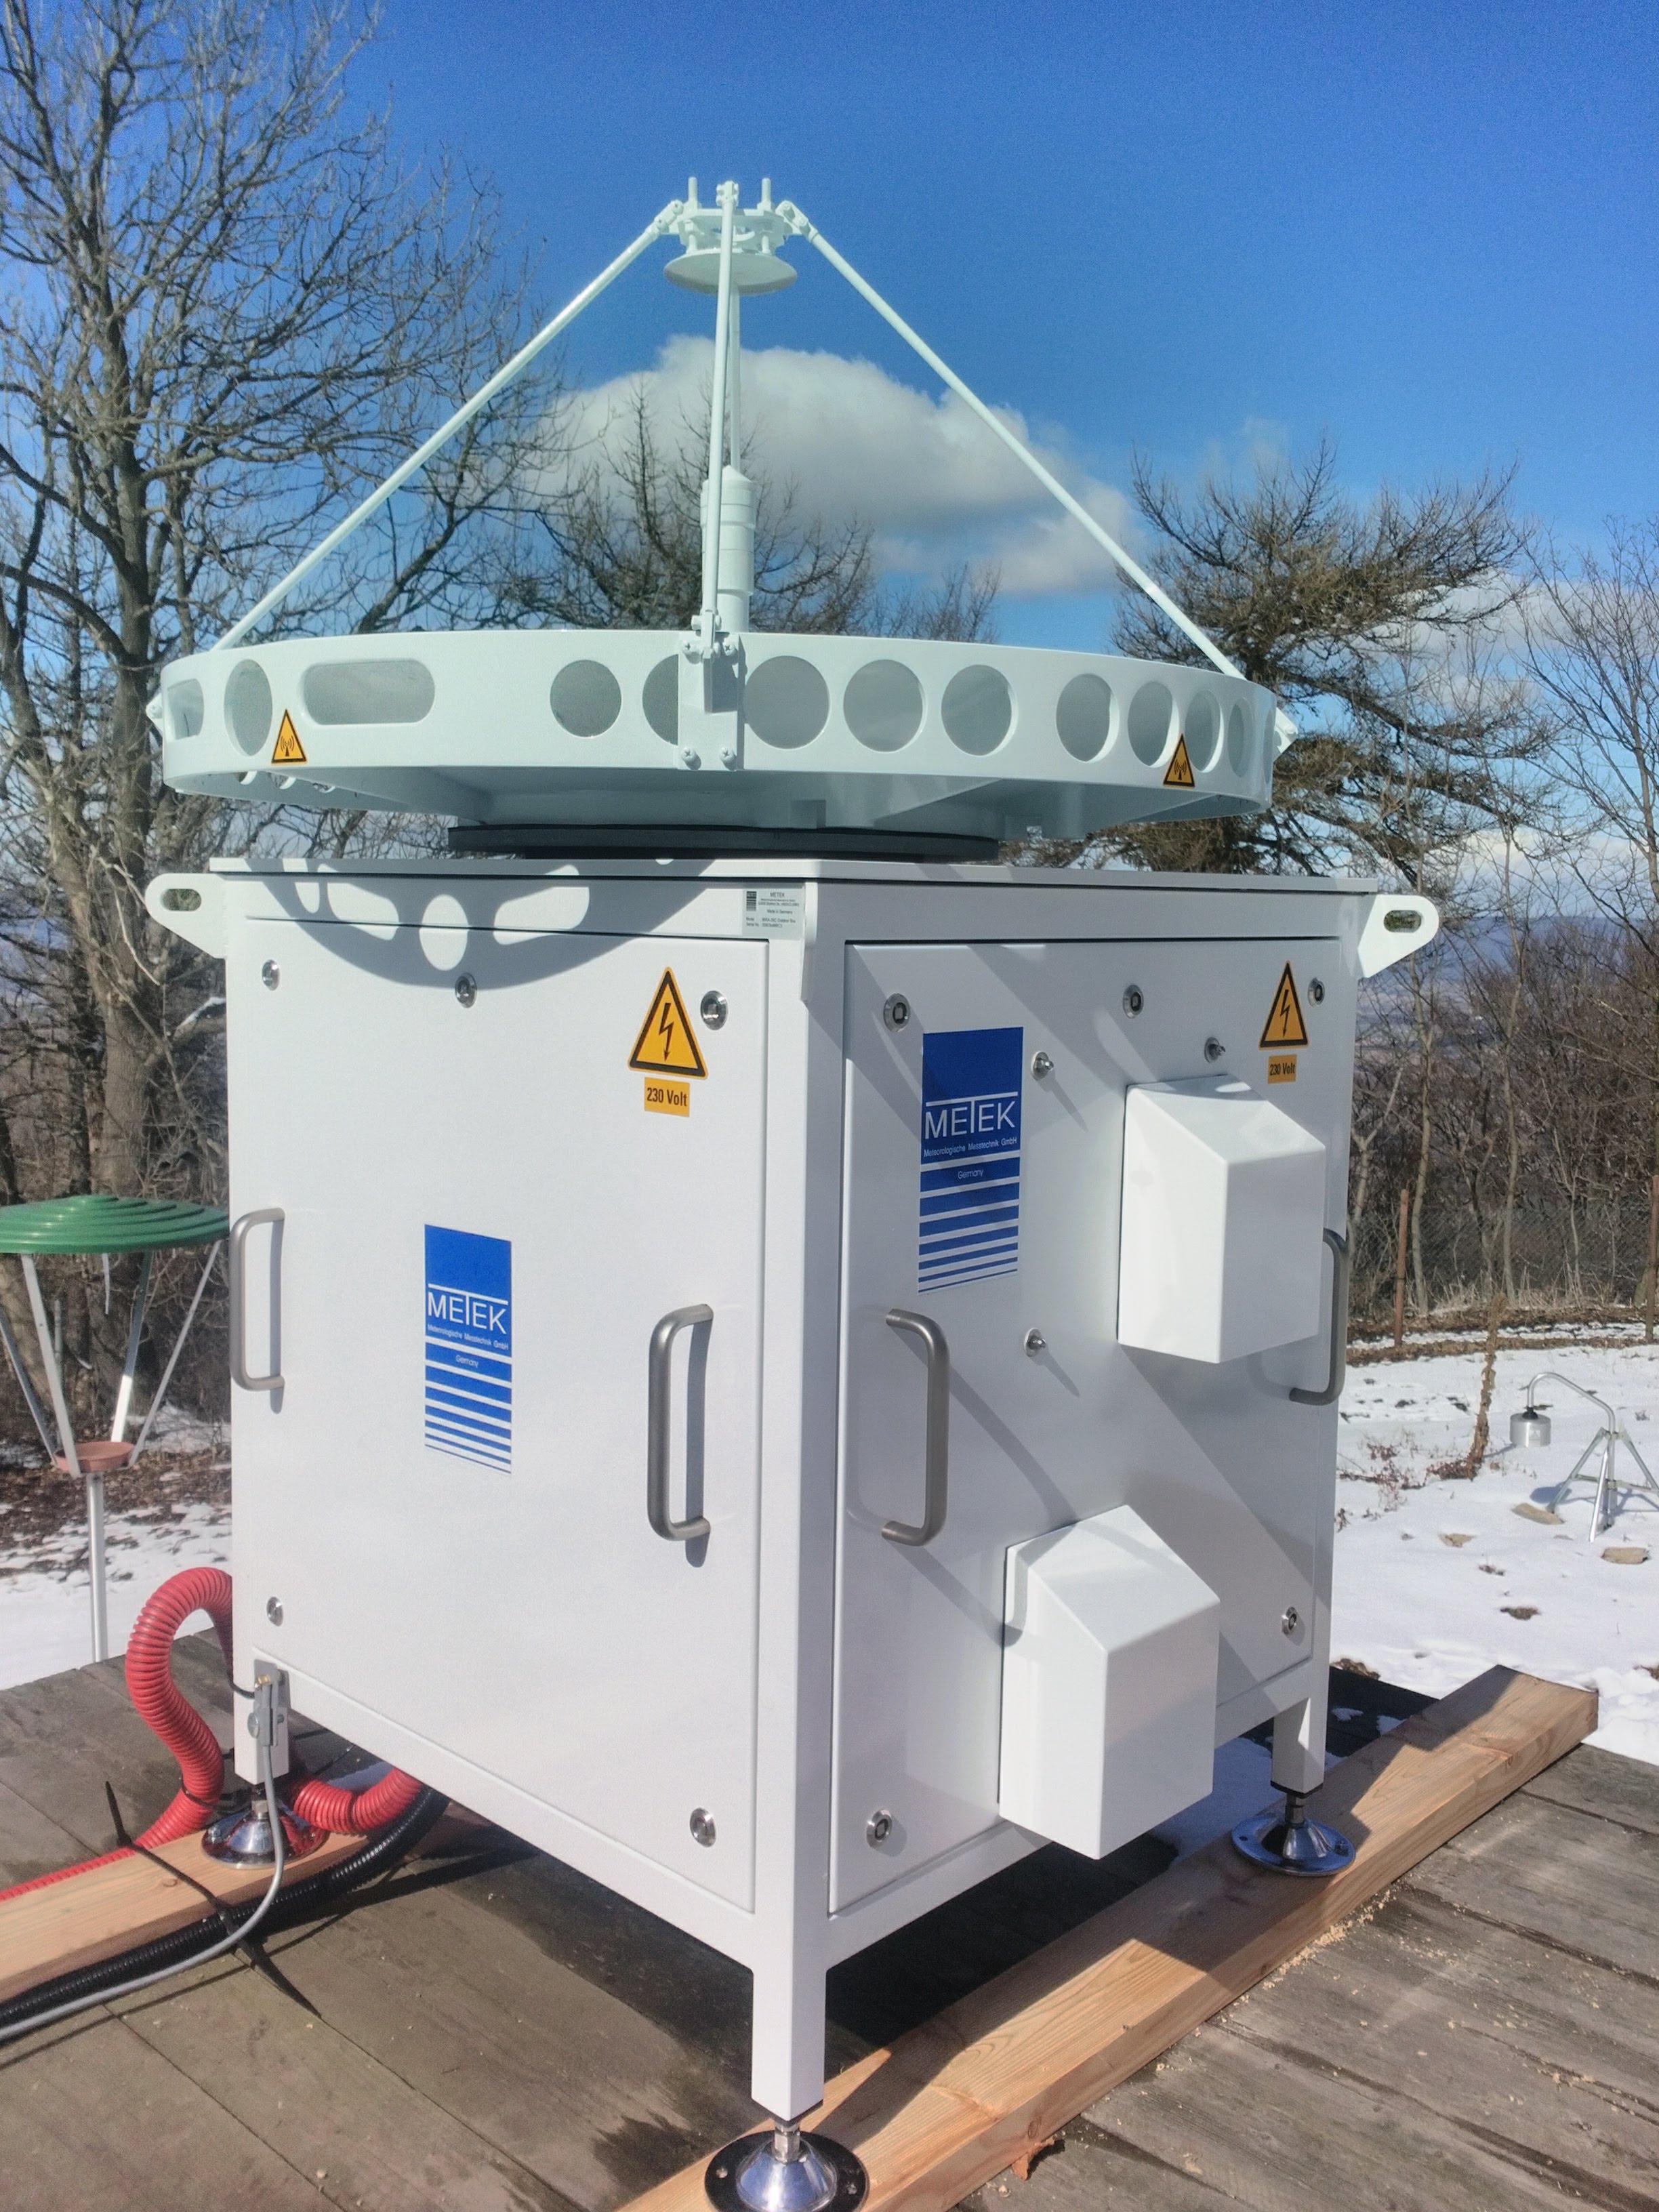
Fig. 1: Ka-band cloud profiler MIRA 35c installed at the Milešovka observatory in spring 2018.

Our current research is also focused on modelling the charge structure of thunderclouds and the lightning activity. For that we use both the explicit and the implicit modelling methods which we implement into numerical weather prediction (NWP) models. For instance, we implemented a Cloud Electrification Model (CEM) in the COSMO NWP model, where we also tested the Lightning Potential Index (LPI; Sokol and Minářová, 2020). Our results confirmed that the LPI is a useful tool for implicit modelling of lightning in our territory (Fig. 5). We also test the LPI in the ICON NWP model. Further, we implemented the CEM, which explicitly treats the ion motion, charge distribution and lightning, into the WISCDYMM-II model. We currently test the model on an idealized thunderstorm but plan to run it for observed thunderstorms as well.

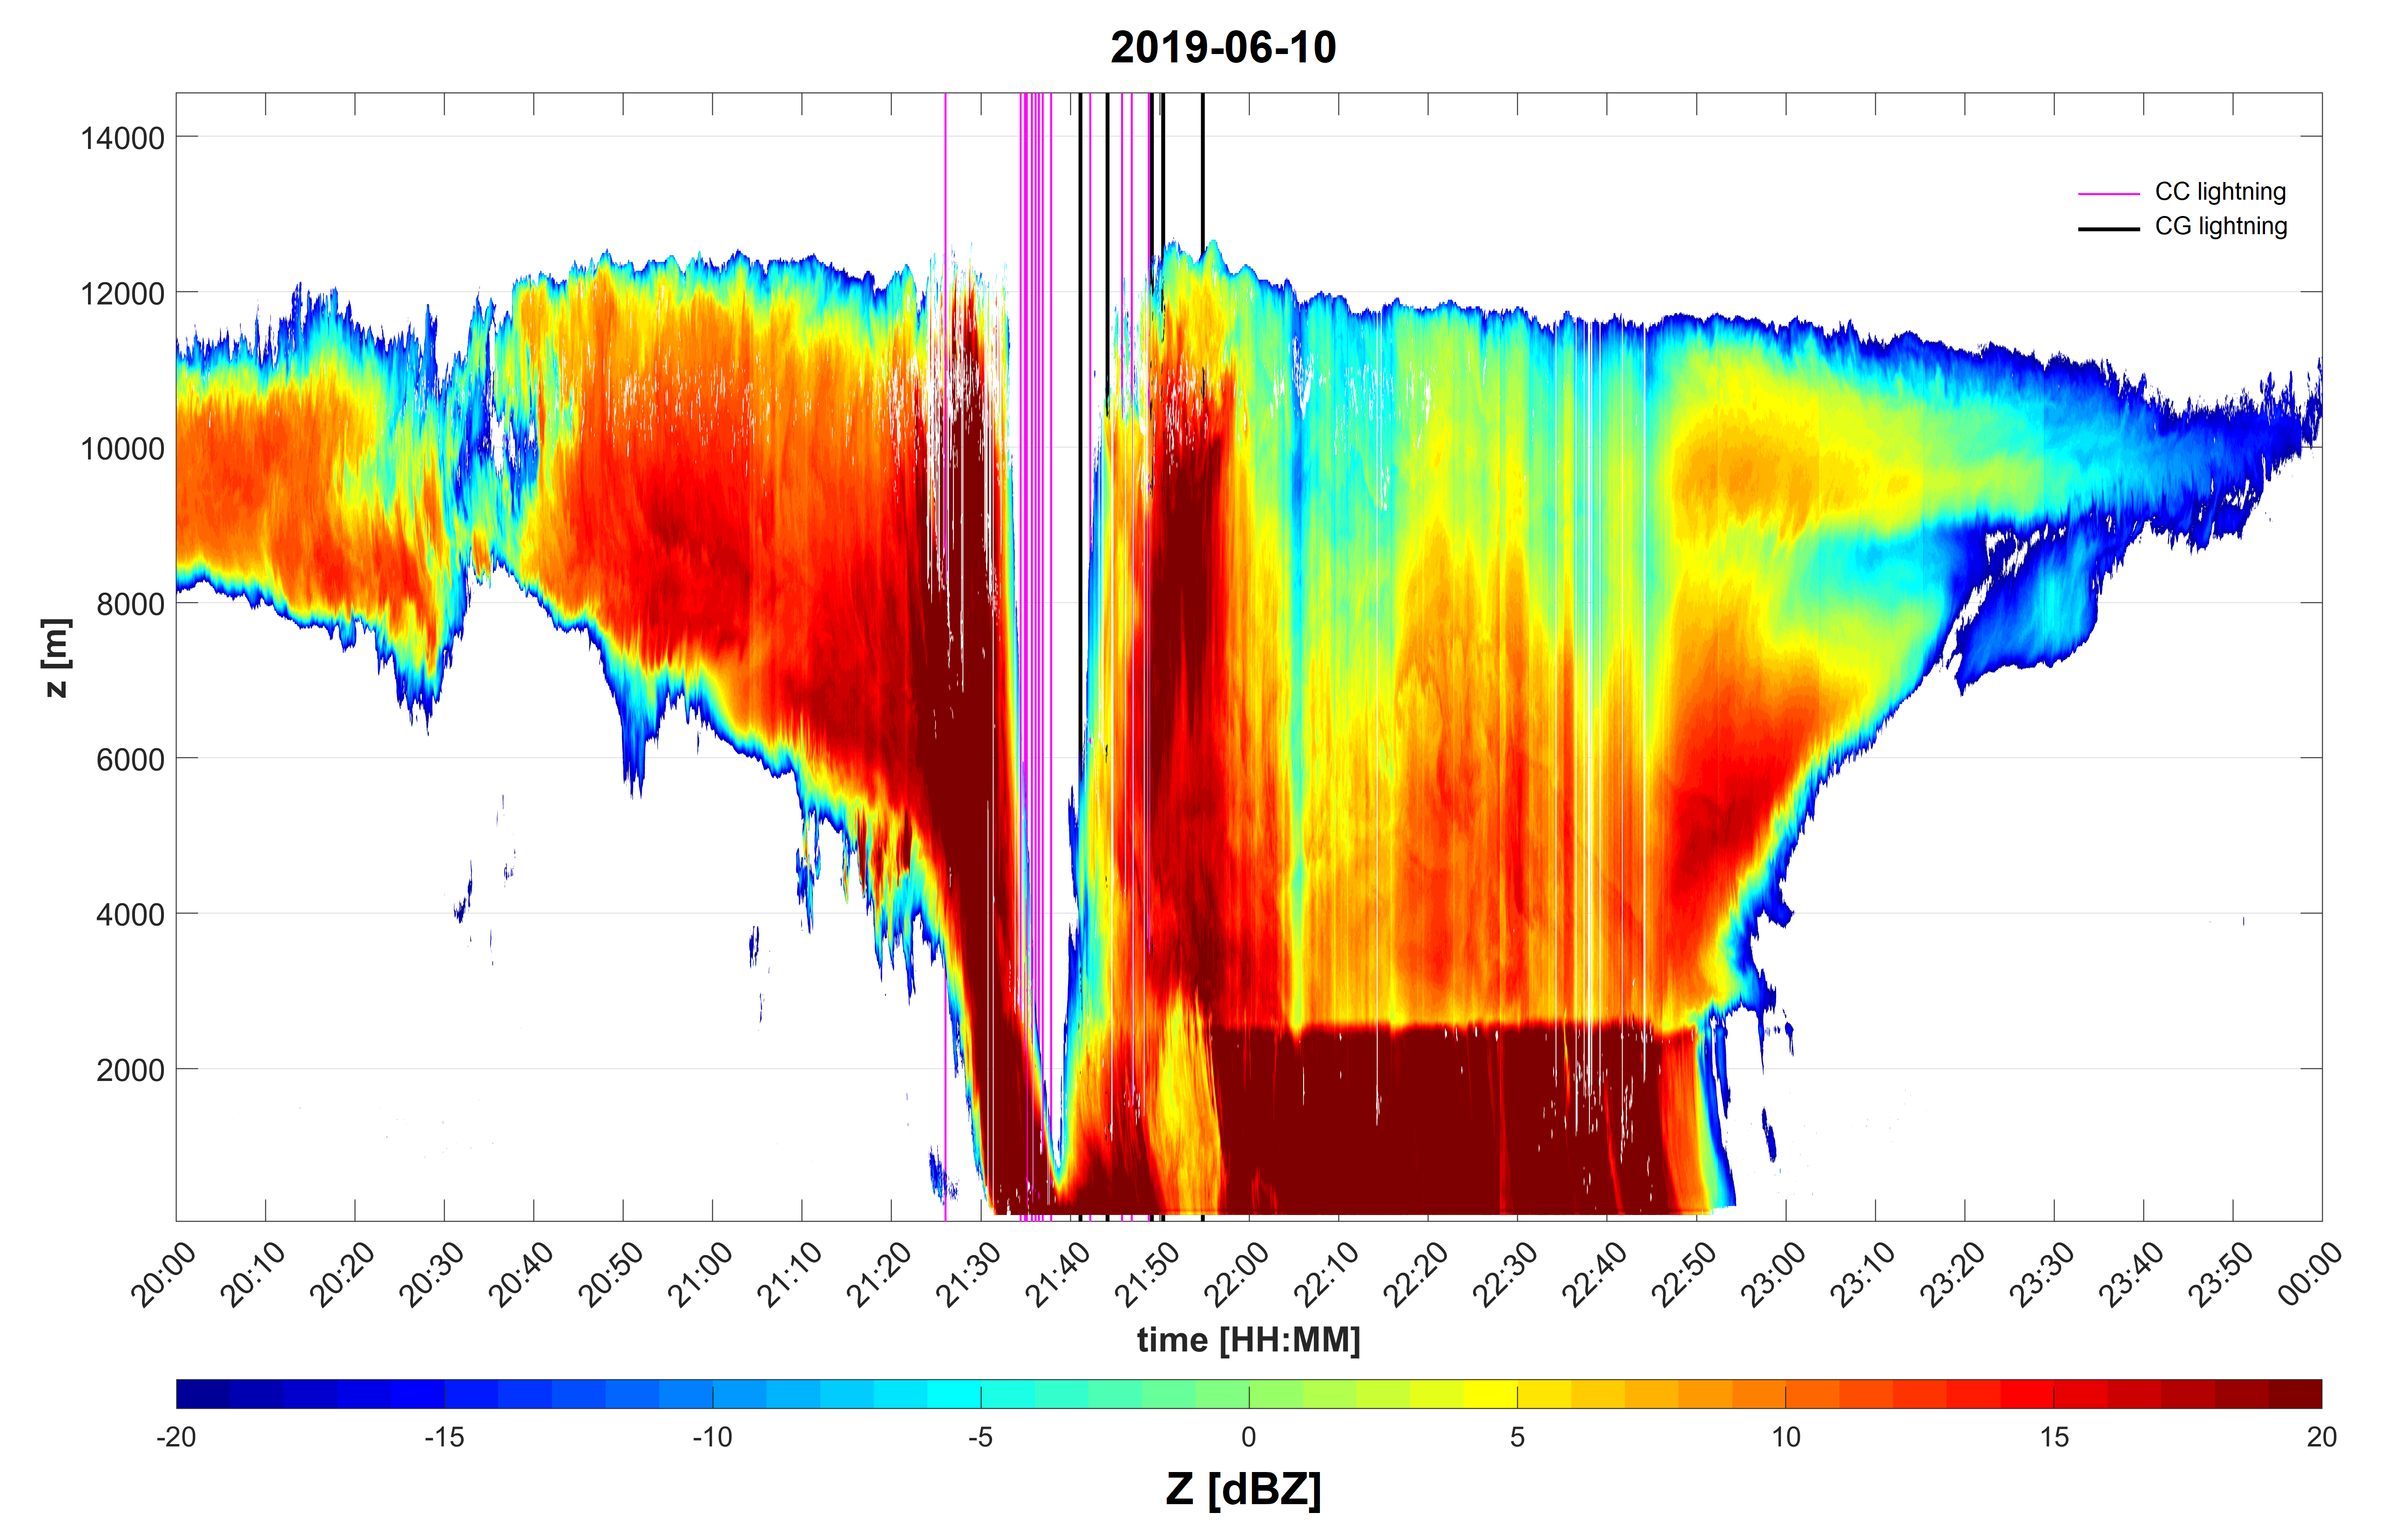
Fig. 2: Vertical profile of the radar reflectivity Z [dBZ] measured by the Ka-band cloud profiler during a thunderstorm on June 10, 2019, and the lightning activity observed up to 1 km from the observatory during the thunderstorm. Cloud-to-Ground lightning discharges (CG) are displayed by a black line, while Cloud-to-Cloud discharges (CC) are depicted by a magenta line.

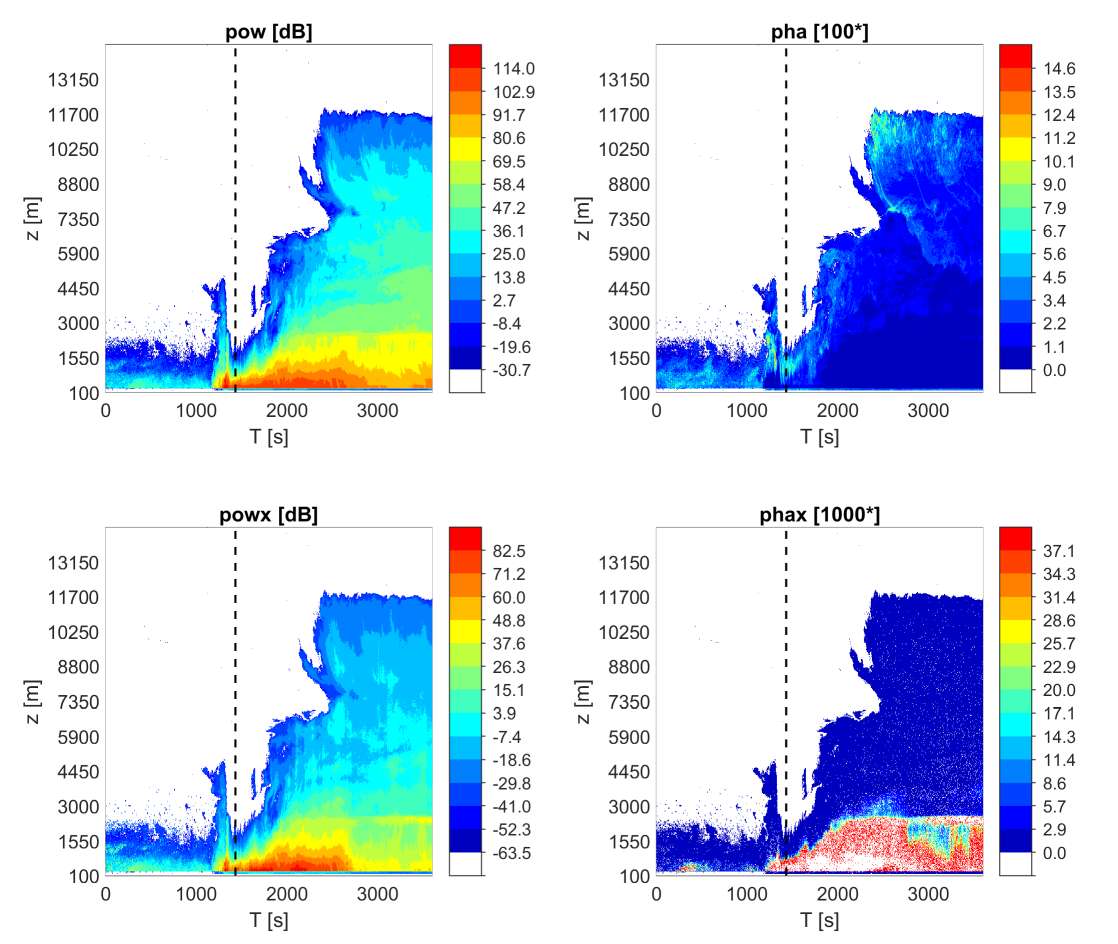
Fig. 3: Time evolution in the vertical profile of power and phase in the co-channel (pow and pha, respectively) and the cross-channel (powx and phax, respectively) from 11:30 to 12:30 UTC on June 1, 2018. Quantities pow and powx are in dB, whereas pha and phax are in arctan of phase degree multiplied by 100 and 1000, respectively. The dashed line shows the time of six recorded lightning discharges registered within 1 s up to 0.75 km from the radar site.

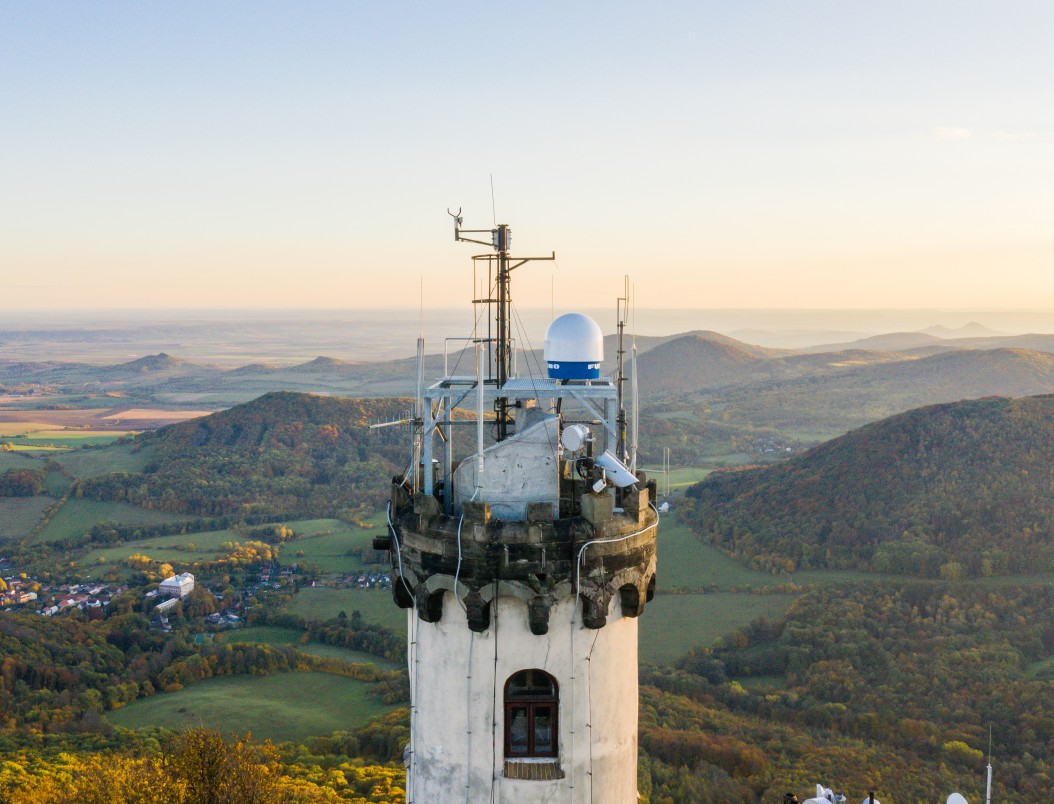
Fig. 4: X-band weather radar FURUNO installed at the Milešovka observatory in autumn 2020.

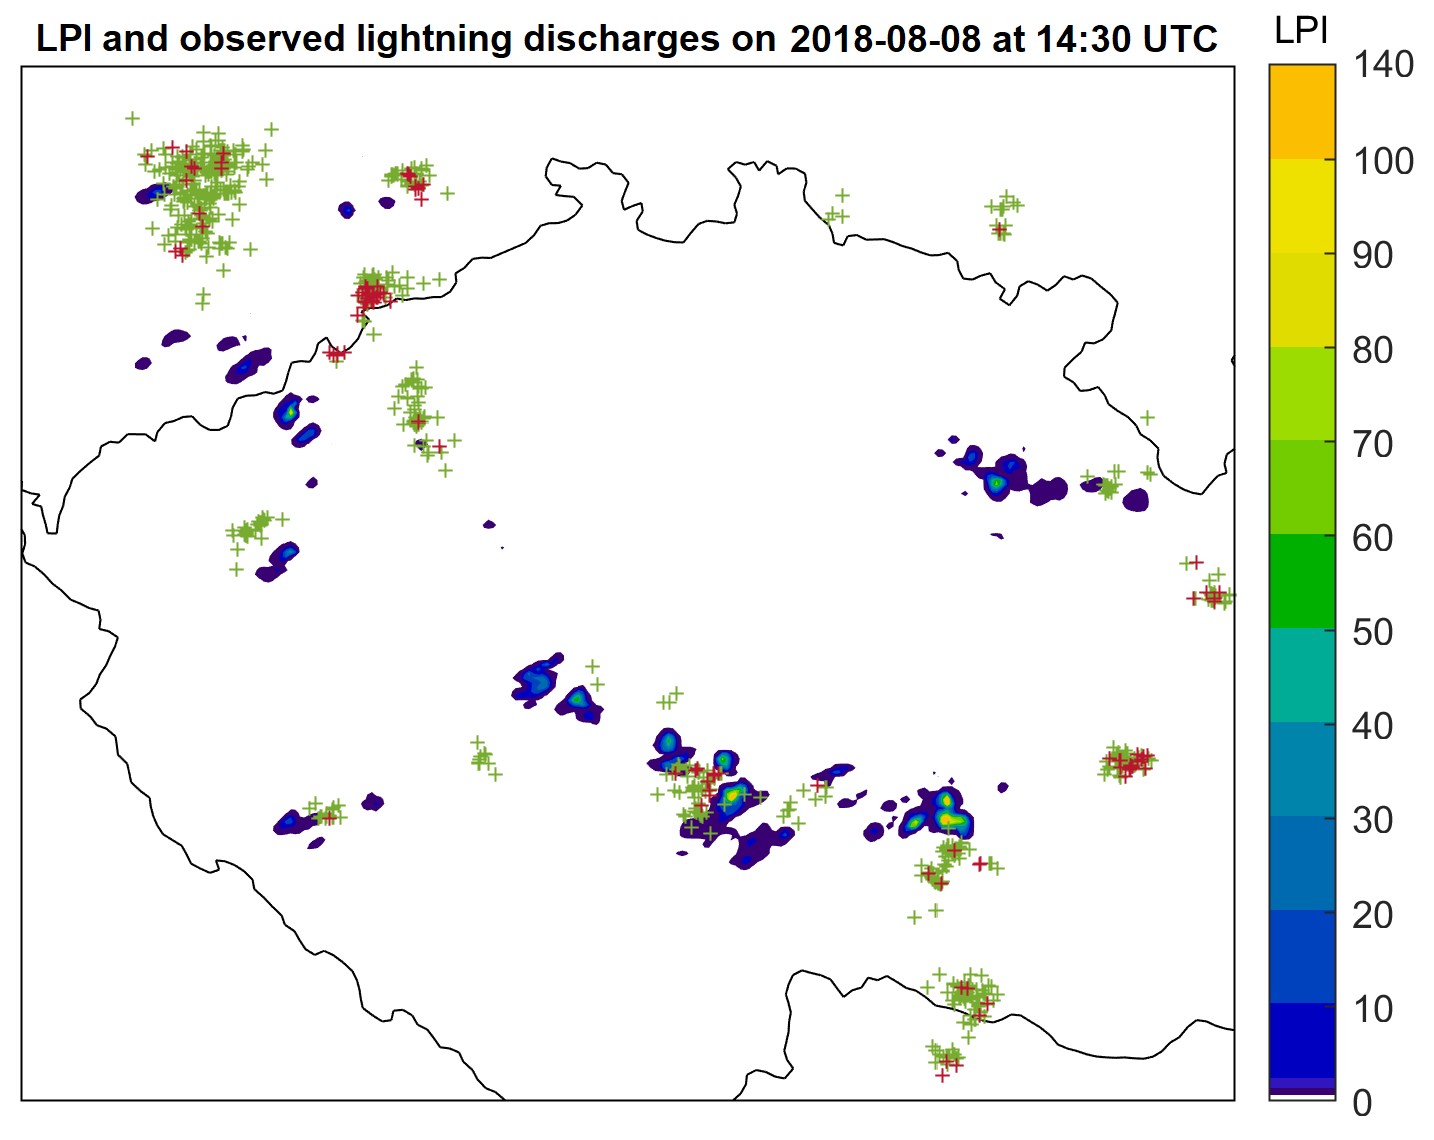
Fig. 5: 15-min LPI [J kg-1] modelled by COSMO NWP model and 15-min sum of observed lightning discharges (Cloud-to-Ground discharges are displayed by red crosses and Cloud-to-Cloud discharges by green crosses) for a thunderstorm on August 8, 2018 at 14:30 UTC. Horizontal resolution of the model is 1.2 km and the cloud microphysical scheme is 2-moment. The simulation run started at 12 h UTC.